Ai Kline
What is Ai Kline
AI-Kline is a Python-based stock analysis tool designed for the A-share market. It integrates traditional technical analysis with AI forecasting capabilities, utilizing K-line charts, technical indicators, financial data, and news data for comprehensive stock analysis and predictions.
Use cases
Use cases include individual investors analyzing stock performance, financial analysts conducting market research, educational institutions teaching stock trading strategies, and developers integrating stock analysis features into applications.
How to use
To use AI-Kline, you can either run it via the command line by specifying the stock code and analysis period or access the user-friendly Web interface to input stock codes and view analysis results. Additionally, it supports interaction through MCP SERVER for real-time analysis.
Key features
Key features include data acquisition using AKShare for historical trading data and financial information, technical analysis with various indicators (MA, MACD, KDJ, RSI, Bollinger Bands), visualization of K-line and technical indicator charts, AI analysis using the Gemini model for future stock predictions, and a clean Web interface for user interaction.
Where to use
AI-Kline can be used in financial analysis, stock trading, investment research, and educational purposes, particularly for those interested in the A-share market and technical stock analysis.
Clients Supporting MCP
The following are the main client software that supports the Model Context Protocol. Click the link to visit the official website for more information.


Overview
What is Ai Kline
AI-Kline is a Python-based stock analysis tool designed for the A-share market. It integrates traditional technical analysis with AI forecasting capabilities, utilizing K-line charts, technical indicators, financial data, and news data for comprehensive stock analysis and predictions.
Use cases
Use cases include individual investors analyzing stock performance, financial analysts conducting market research, educational institutions teaching stock trading strategies, and developers integrating stock analysis features into applications.
How to use
To use AI-Kline, you can either run it via the command line by specifying the stock code and analysis period or access the user-friendly Web interface to input stock codes and view analysis results. Additionally, it supports interaction through MCP SERVER for real-time analysis.
Key features
Key features include data acquisition using AKShare for historical trading data and financial information, technical analysis with various indicators (MA, MACD, KDJ, RSI, Bollinger Bands), visualization of K-line and technical indicator charts, AI analysis using the Gemini model for future stock predictions, and a clean Web interface for user interaction.
Where to use
AI-Kline can be used in financial analysis, stock trading, investment research, and educational purposes, particularly for those interested in the A-share market and technical stock analysis.
Clients Supporting MCP
The following are the main client software that supports the Model Context Protocol. Click the link to visit the official website for more information.
Content
AI看线 - 股票技术分析与AI预测工具(AI-Kline - Stock Technical Analysis and AI Prediction Tool)
项目简介
AI看线是一个基于Python的A股分析工具,结合了传统技术分析和人工智能预测功能。利用K线图,技术指标,财务数据,新闻数据对股票进行全面分析及预测。该工具可以:
- 获取A股股票的历史量价数据并计算各种技术指标
- 生成专业的K线图和技术指标可视化图表
- 获取股票相关的财务数据和新闻信息
- 使用Google的Gemini AI模型分析整合数据并预测股票未来走势
功能特点
- 数据获取:使用AKShare获取A股股票的历史交易数据、财务数据和新闻信息
- 技术分析:计算多种技术指标,包括MA、MACD、KDJ、RSI、布林带等
- 可视化:生成静态和交互式K线图及技术指标图表
- AI分析:利用Gemini AI模型分析股票数据并预测未来走势
- Web界面:提供简洁美观的Web界面,方便用户输入股票代码查看分析结果
- MCP SERVER:提供MCP SERVER支持,支持通过LLM交互,随时分析股票
安装说明
环境要求
- Python 3.8+
- 依赖包:见
requirements.txt
安装步骤
-
克隆或下载本项目到本地
-
安装依赖包
pip install -r requirements.txt
- 创建
.env文件,添加Gemini API密钥
GEMINI_API_KEY=your_api_key_here
注意:获取Gemini API密钥需要在Google AI Studio注册并创建API密钥
使用方法
命令行使用
python main.py --stock_code 000001 --period 1年 --save_path ./output
参数说明:
--stock_code:股票代码,必填参数--period:分析周期,可选值:“1年”、“6个月”、“3个月”、“1个月”,默认为"1年"--save_path:结果保存路径,默认为"./output"
Web界面使用
启动Web服务:
python web_app.py
然后在浏览器中访问 http://localhost:5000 即可使用Web界面:
- 在表单中输入股票代码(例如:000001)
- 选择分析周期
- 点击"开始分析"按钮
- 等待分析完成后查看结果
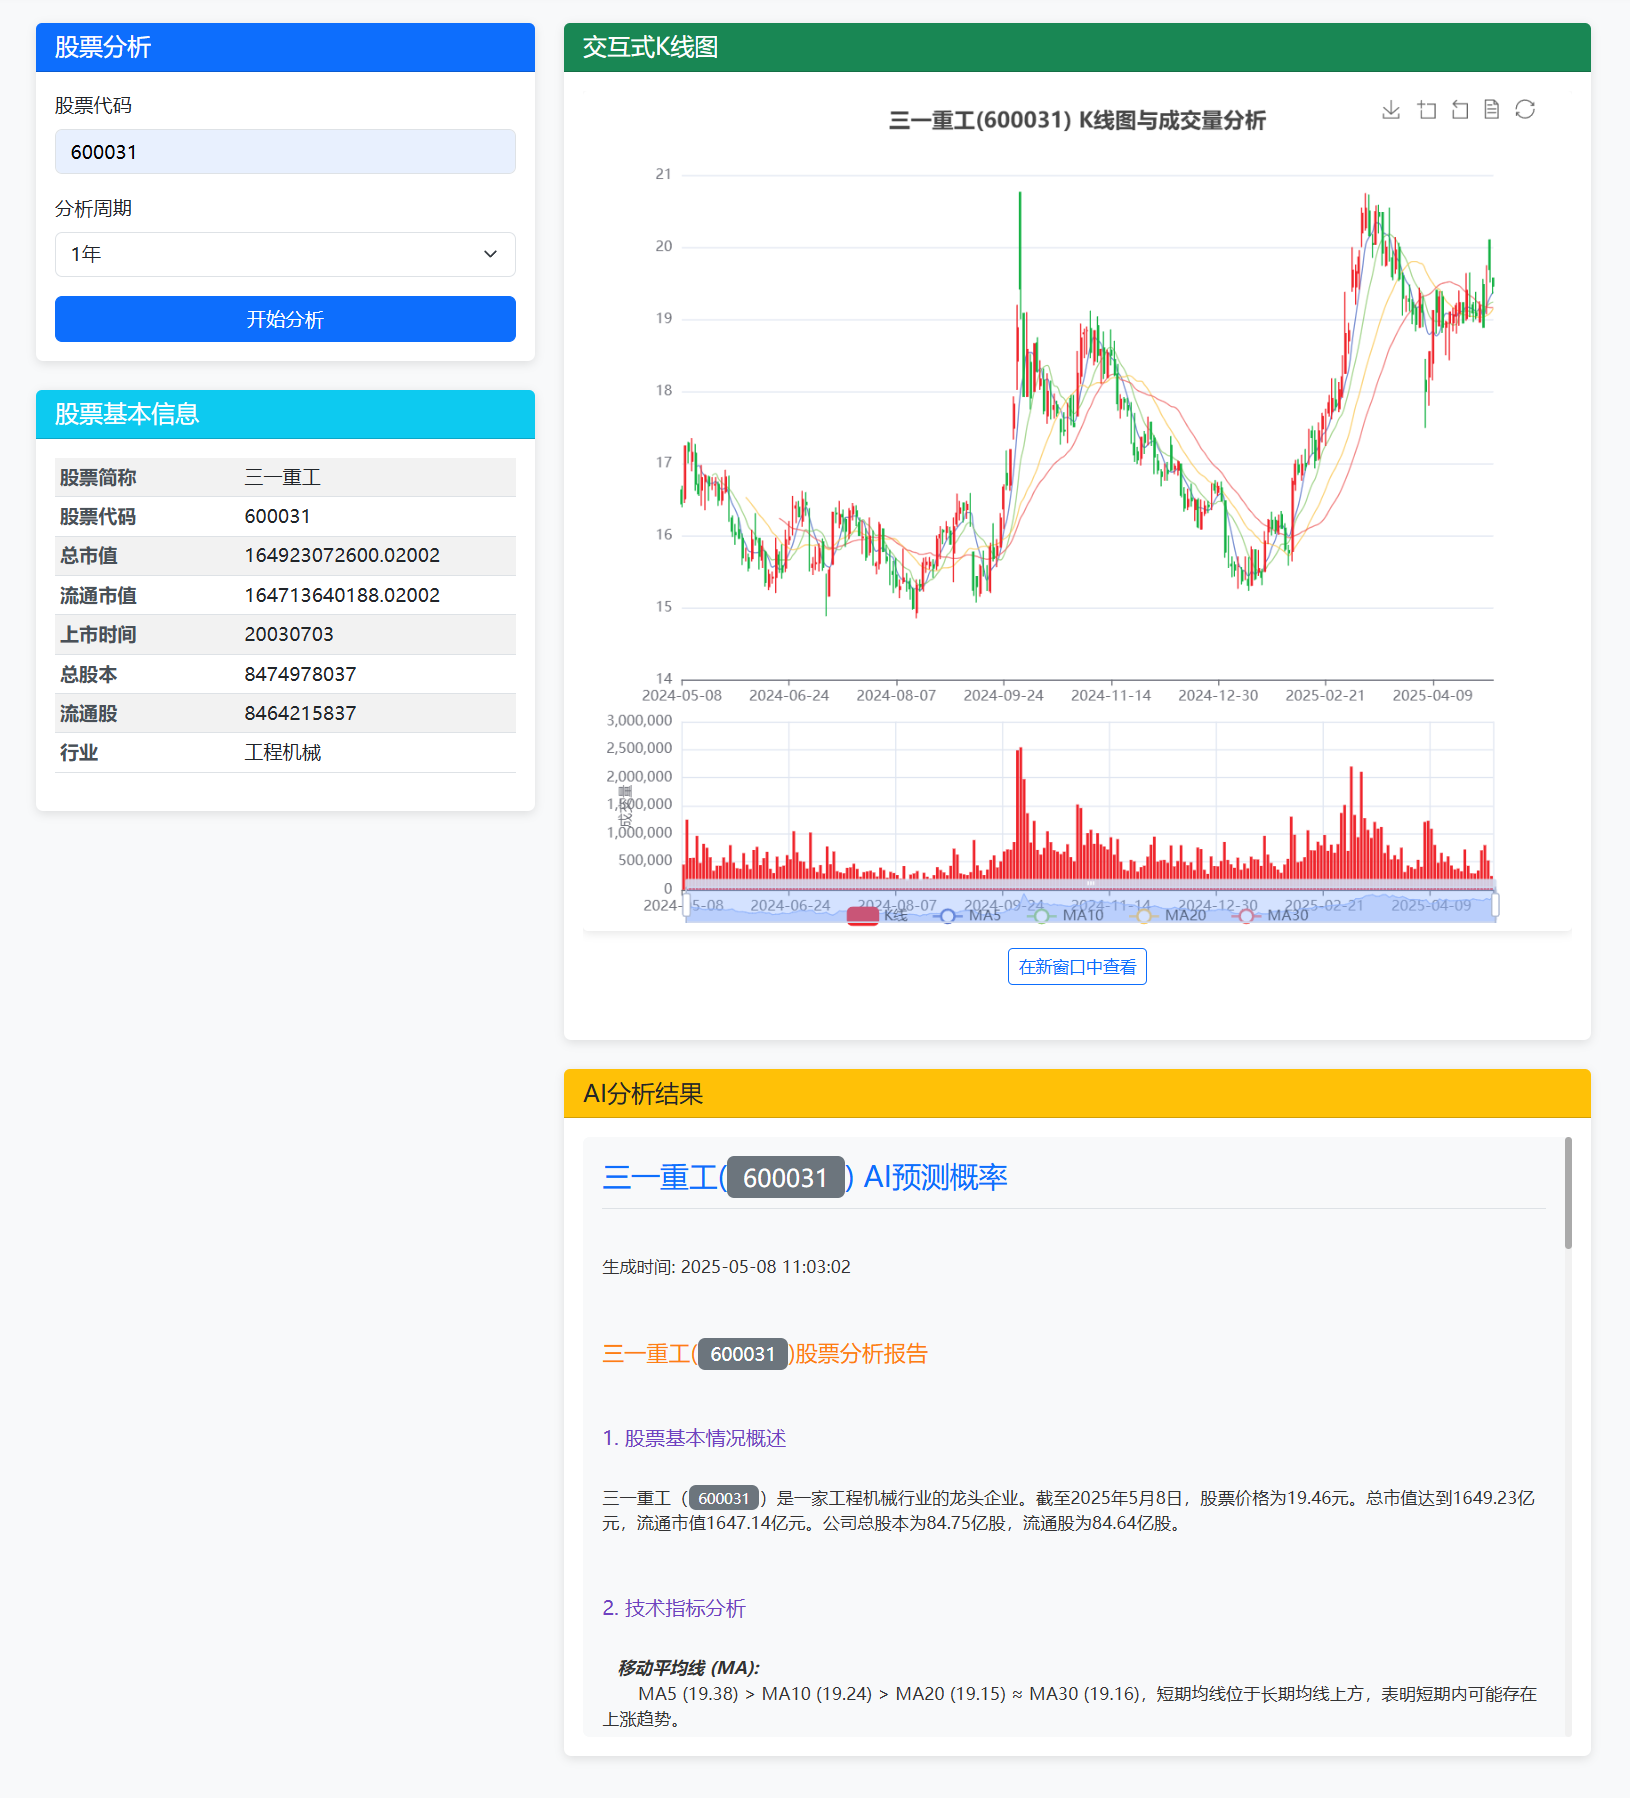
Web界面包括以下内容:
- 股票基本信息
- K线图和技术指标图表
- AI分析结果文本
页面截图:
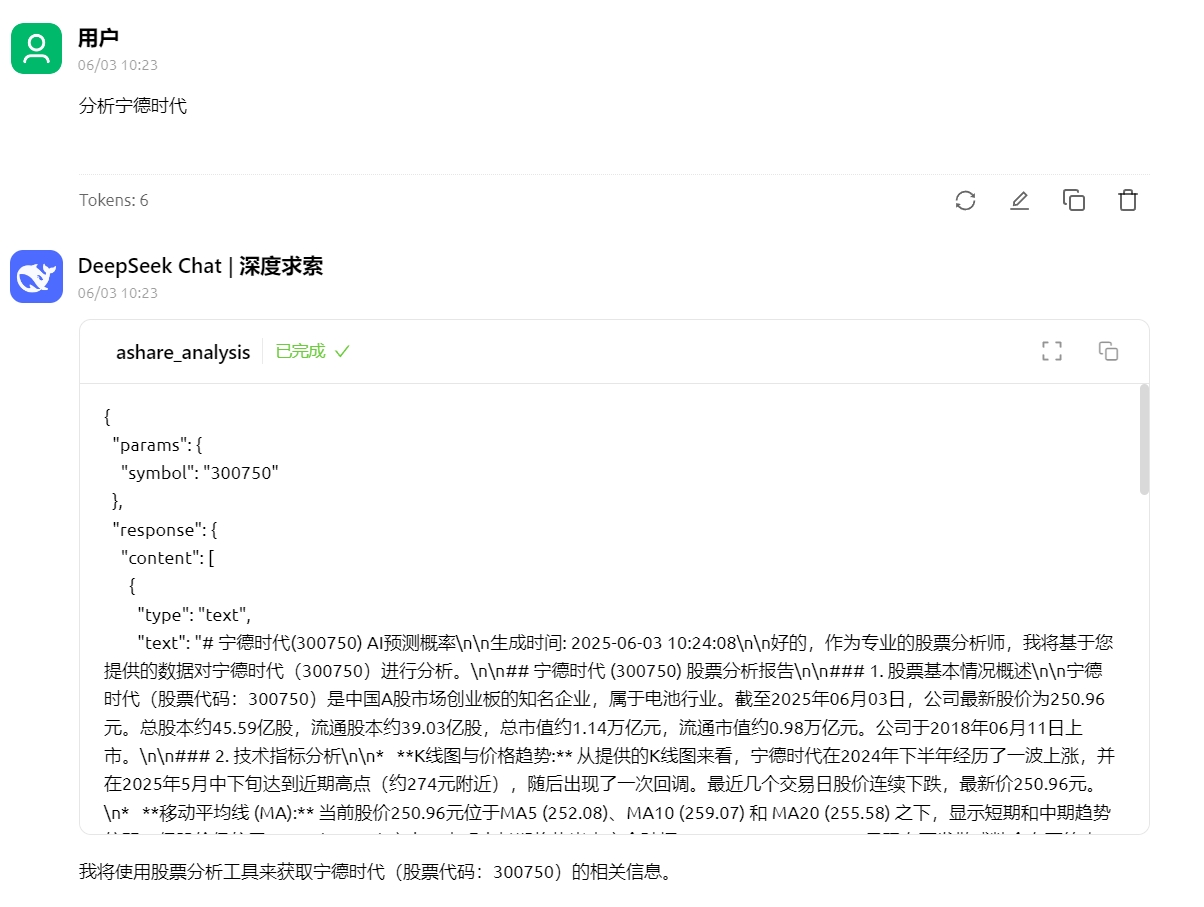
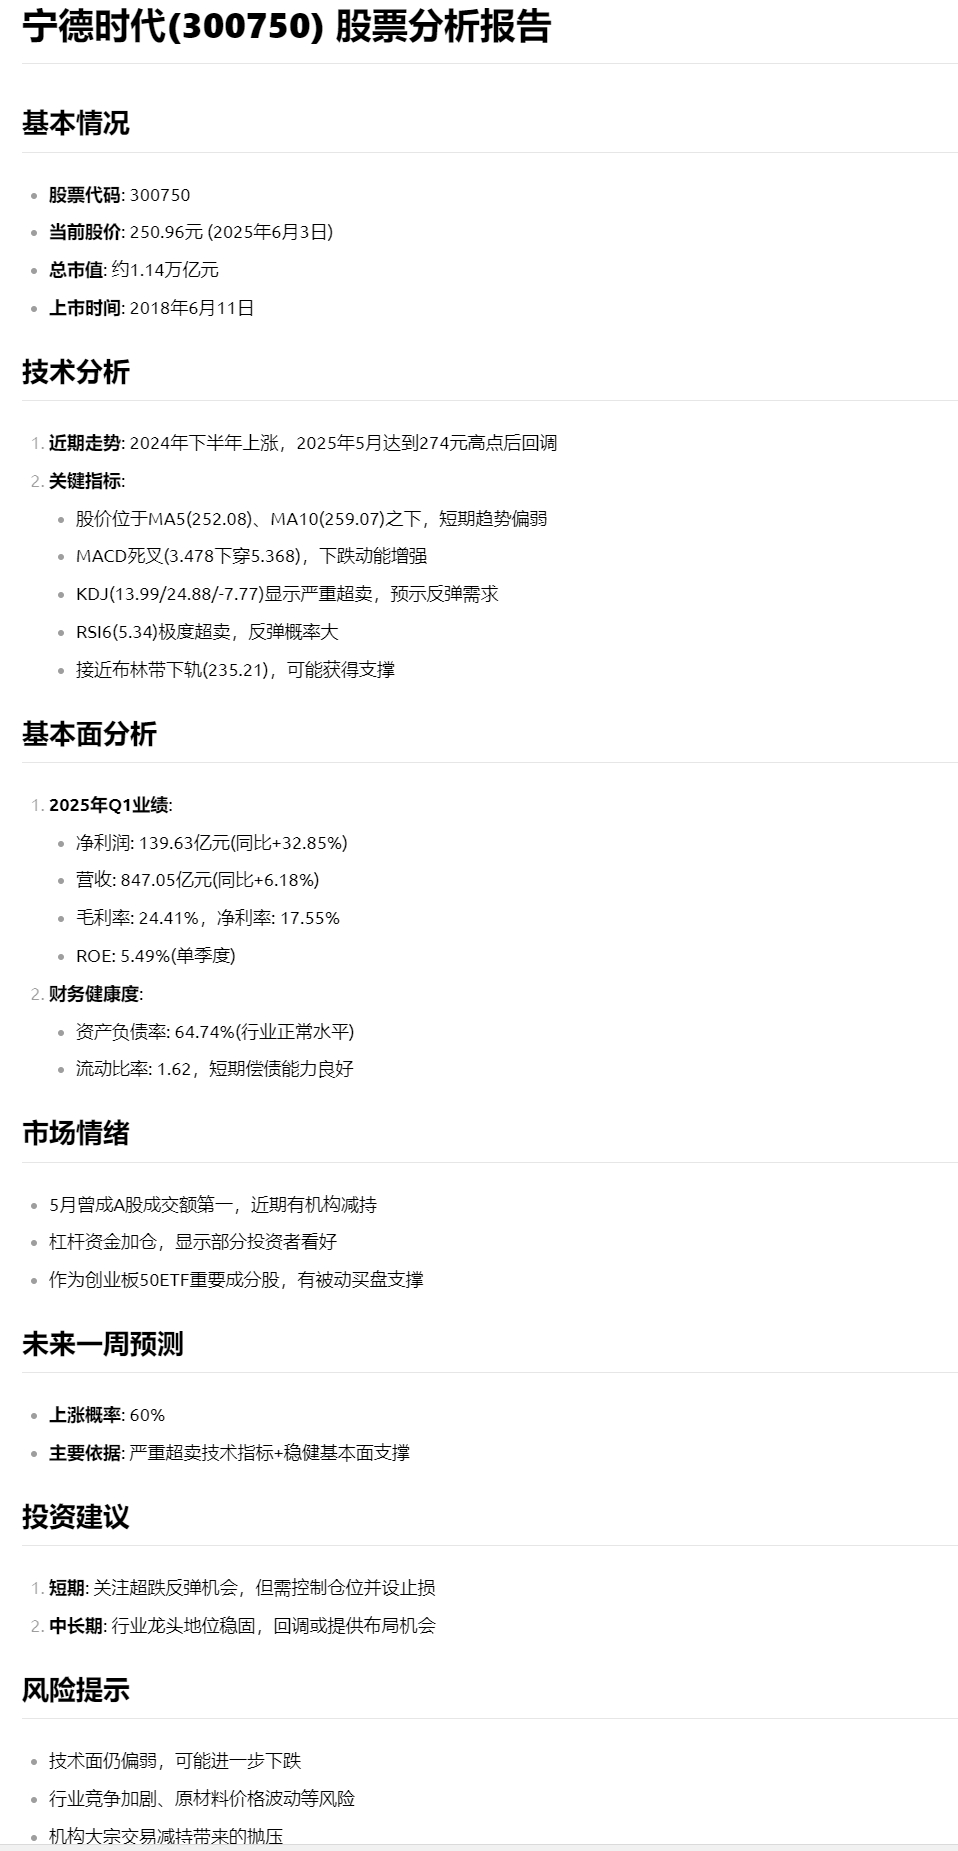
MCP SERVER使用
启动mcp:
uv run mcp_server.py
然后在mcp客户端中配置(streamable-http):
http://localhost:8000/mcp
Cherry-Studio页面截图:
输出结果
程序运行后将在指定的保存路径下生成:
- K线图和技术指标图表(静态PNG图片和交互式HTML图表)
- AI分析结果文本文件
项目结构
AI看线/
├── main.py                 # 主程序入口
├── web_app.py              # Web应用入口
├── requirements.txt        # 依赖包列表
├── .env                    # 环境变量配置(需自行创建)
├── modules/                # 功能模块
│   ├── __init__.py
│   ├── data_fetcher.py     # 数据获取模块
│   ├── technical_analyzer.py # 技术分析模块
│   ├── visualizer.py       # 可视化模块
│   └── ai_analyzer.py      # AI分析模块
├── templates/              # Web模板目录
│   └── index.html          # 主页模板
├── static/                 # 静态资源目录
│   ├── css/                # CSS样式
│   │   └── style.css       # 自定义样式
│   └── js/                 # JavaScript脚本
│       └── main.js         # 主要脚本
└── output/                 # 输出结果目录(运行时自动创建)
    ├── charts/             # 图表目录
    └── *_analysis_result.txt # 分析结果文件
交流学习

注意事项
- 本工具仅供学习和研究使用,不构成任何投资建议
- AI分析结果基于历史数据和当前信息,不能保证未来走势的准确性
- 使用前请确保已正确配置Gemini API密钥
- 股票数据获取依赖于AKShare库,可能受到网络和数据源的限制
- 本项目为QuantML开源项目,转载或使用需注明出处,商业使用请联系微信号QuantML
免责声明
本工具提供的分析和预测仅供参考,不构成任何投资建议。投资有风险,入市需谨慎。用户应对自己的投资决策负责。
Dev Tools Supporting MCP
The following are the main code editors that support the Model Context Protocol. Click the link to visit the official website for more information.


