Mcp Arm Live Data
What is Mcp Arm Live Data
MCP-ARM-Live-Data is an MCP (Model Context Protocol) server designed for accessing ARM Live Data databases, enabling users to retrieve real-time meteorological data from the ARM user facility program.
Use cases
Use cases include retrieving specific meteorological data for research projects, integrating live data into applications for analysis, and providing real-time data access for environmental monitoring systems.
How to use
To use MCP-ARM-Live-Data, set up your environment by installing ‘uv’, initializing the project, creating a virtual environment, and installing necessary dependencies. Configure your ARM user ID and access token in a ‘.env’ file, build the Docker image, and add the MCP server to the Claude Desktop app configuration.
Key features
Key features include the ability to query live meteorological data, support for various datastream identifiers, and integration with the Claude Desktop app for easy access and management of data.
Where to use
MCP-ARM-Live-Data is primarily used in meteorological research, environmental monitoring, and any application that requires real-time access to atmospheric data.
Clients Supporting MCP
The following are the main client software that supports the Model Context Protocol. Click the link to visit the official website for more information.


Overview
What is Mcp Arm Live Data
MCP-ARM-Live-Data is an MCP (Model Context Protocol) server designed for accessing ARM Live Data databases, enabling users to retrieve real-time meteorological data from the ARM user facility program.
Use cases
Use cases include retrieving specific meteorological data for research projects, integrating live data into applications for analysis, and providing real-time data access for environmental monitoring systems.
How to use
To use MCP-ARM-Live-Data, set up your environment by installing ‘uv’, initializing the project, creating a virtual environment, and installing necessary dependencies. Configure your ARM user ID and access token in a ‘.env’ file, build the Docker image, and add the MCP server to the Claude Desktop app configuration.
Key features
Key features include the ability to query live meteorological data, support for various datastream identifiers, and integration with the Claude Desktop app for easy access and management of data.
Where to use
MCP-ARM-Live-Data is primarily used in meteorological research, environmental monitoring, and any application that requires real-time access to atmospheric data.
Clients Supporting MCP
The following are the main client software that supports the Model Context Protocol. Click the link to visit the official website for more information.
Content
MCP Server for ARM Live Data database
An MCP (Model Context Protocol) server for accessing ARM Live Data databases from the ARM user facility program.
Usage
Set up your environment in MaxOS/Linus
For setup in Windows, please refer to the official guide.
Install uv.
curl -LsSf https://astral.sh/uv/install.sh | sh
Restart your terminal after installing uv.
Set up project
# Create a new directory for this project or initialize it with an existing folder
uv init MCP-ARM-Live-Data
cd MCP-ARM-Live-Data

# Create virtual environment and activate it
uv venv
source .venv/bin/activate

# Install dependencies
uv add "mcp[cli]" "requests"
Create .env to store ARM user ID and access token.
To retrieve your access token, please refer to the official guide.
ARM_USERNAME=user_id
ARM_API_TOKEN=access_token
Build docker image.
Doacker Image Name: arm-live-data
docker build -t arm-live-data .
Add this MCP server to Claude Desktop app.
To use this server with the Claude Desktop app, add the following configuration to the “mcpServers” section of your claude_desktop_config.json:
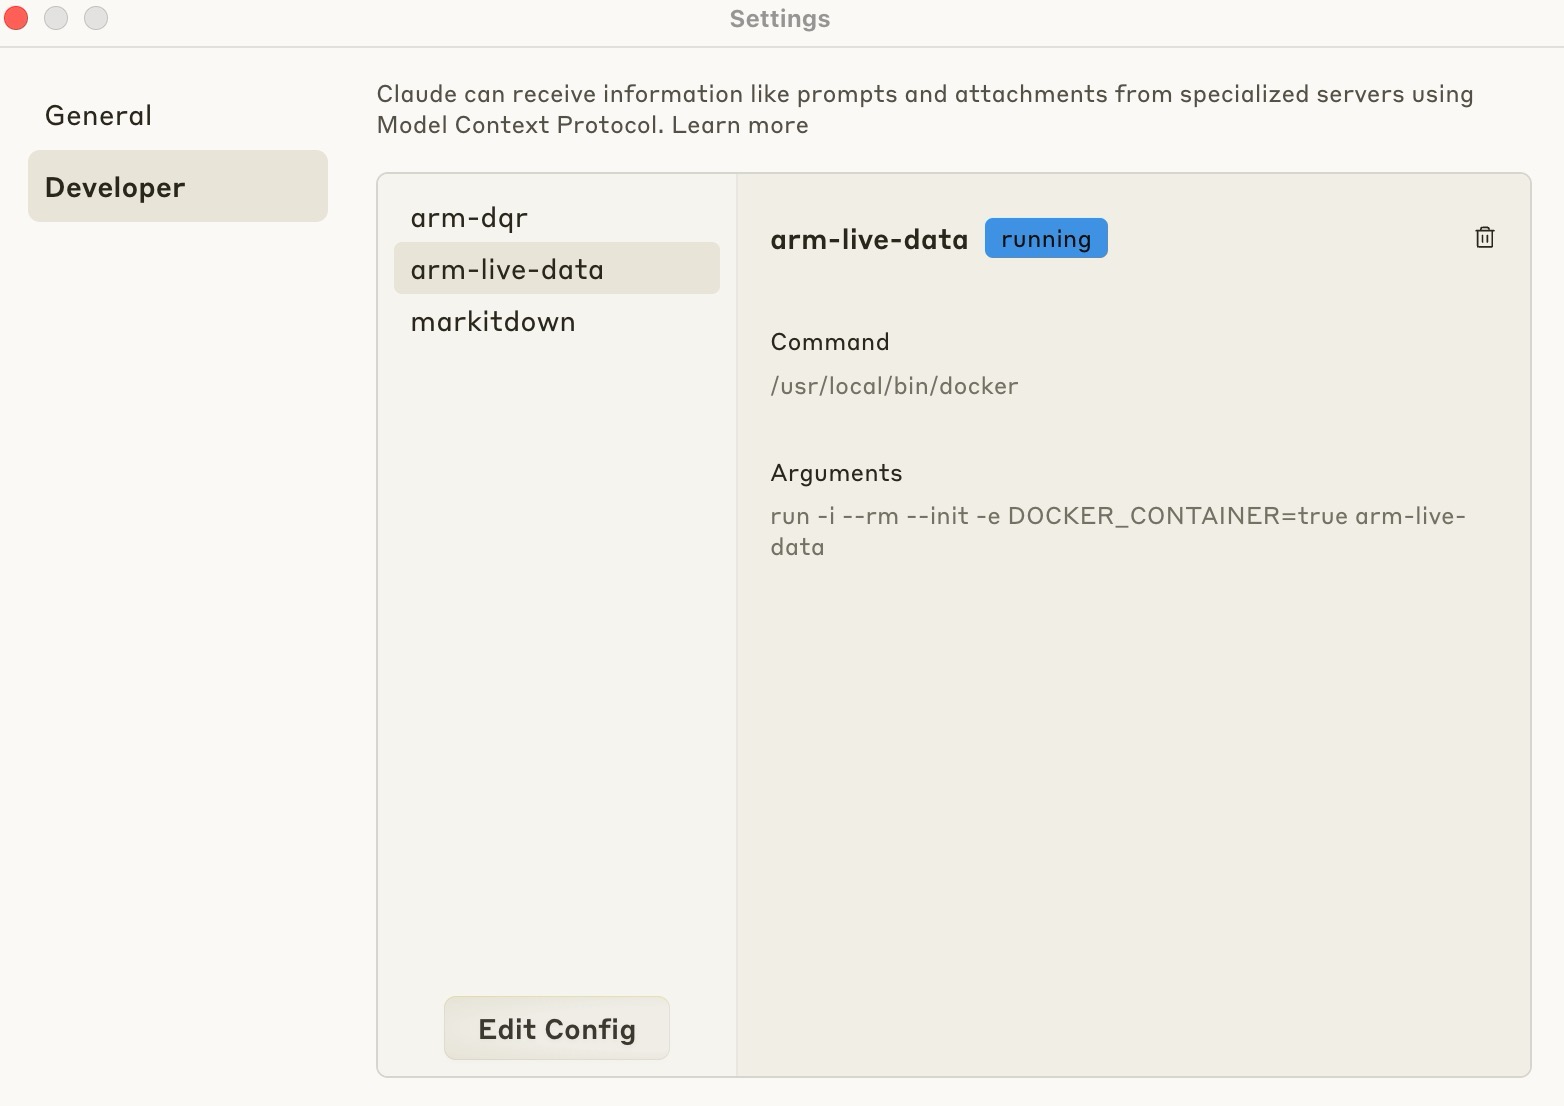
{
  "mcpServers": {
    "arm-live-data": {
      "command": "/usr/local/bin/docker",
      "args": [
        "run",
        "-i",
        "--rm",
        "--init",
        "-e",
        "DOCKER_CONTAINER=true",
        "arm-live-data"
      ]
    }
  }
}
Components
Tools
-
query_live_data
- Description: Retrieves meteorological data from the ARM Live Data API for a specified datastream and time range
- Parameters:
datastream: The datastream identifier to query (required), following the format [site][timeIntegration][inst][facility].[dataLvl], e.g. sgpmetE11.b1start_time: Start time for data query (optional, defaults to 1 hour ago) in format YYYY-MM-DD or YYYY-MM-DDThh:mm:sssZend_time: End time for data query (optional, defaults to current time) in format YYYY-MM-DD or YYYY-MM-DDThh:mm:sssZ
- Returns: Dictionary containing the requested live data, including metadata and file information
-
return_cdf_data
- Description: Downloads a CDF file from the ARM Live Data API and extracts data for a specific meteorological variable
- Parameters:
cdf_file: The complete CDF filename to download (e.g. ‘nsametC1.b1.20200101.000000.cdf’)variable: The specific meteorological variable to extract (e.g. ‘rh_mean’ for relative humidity)
- Returns: Numpy array containing the time series data for the specified variable
For more details about ARM Live Data API and datastream formats, please refer to the official guide.
Examples
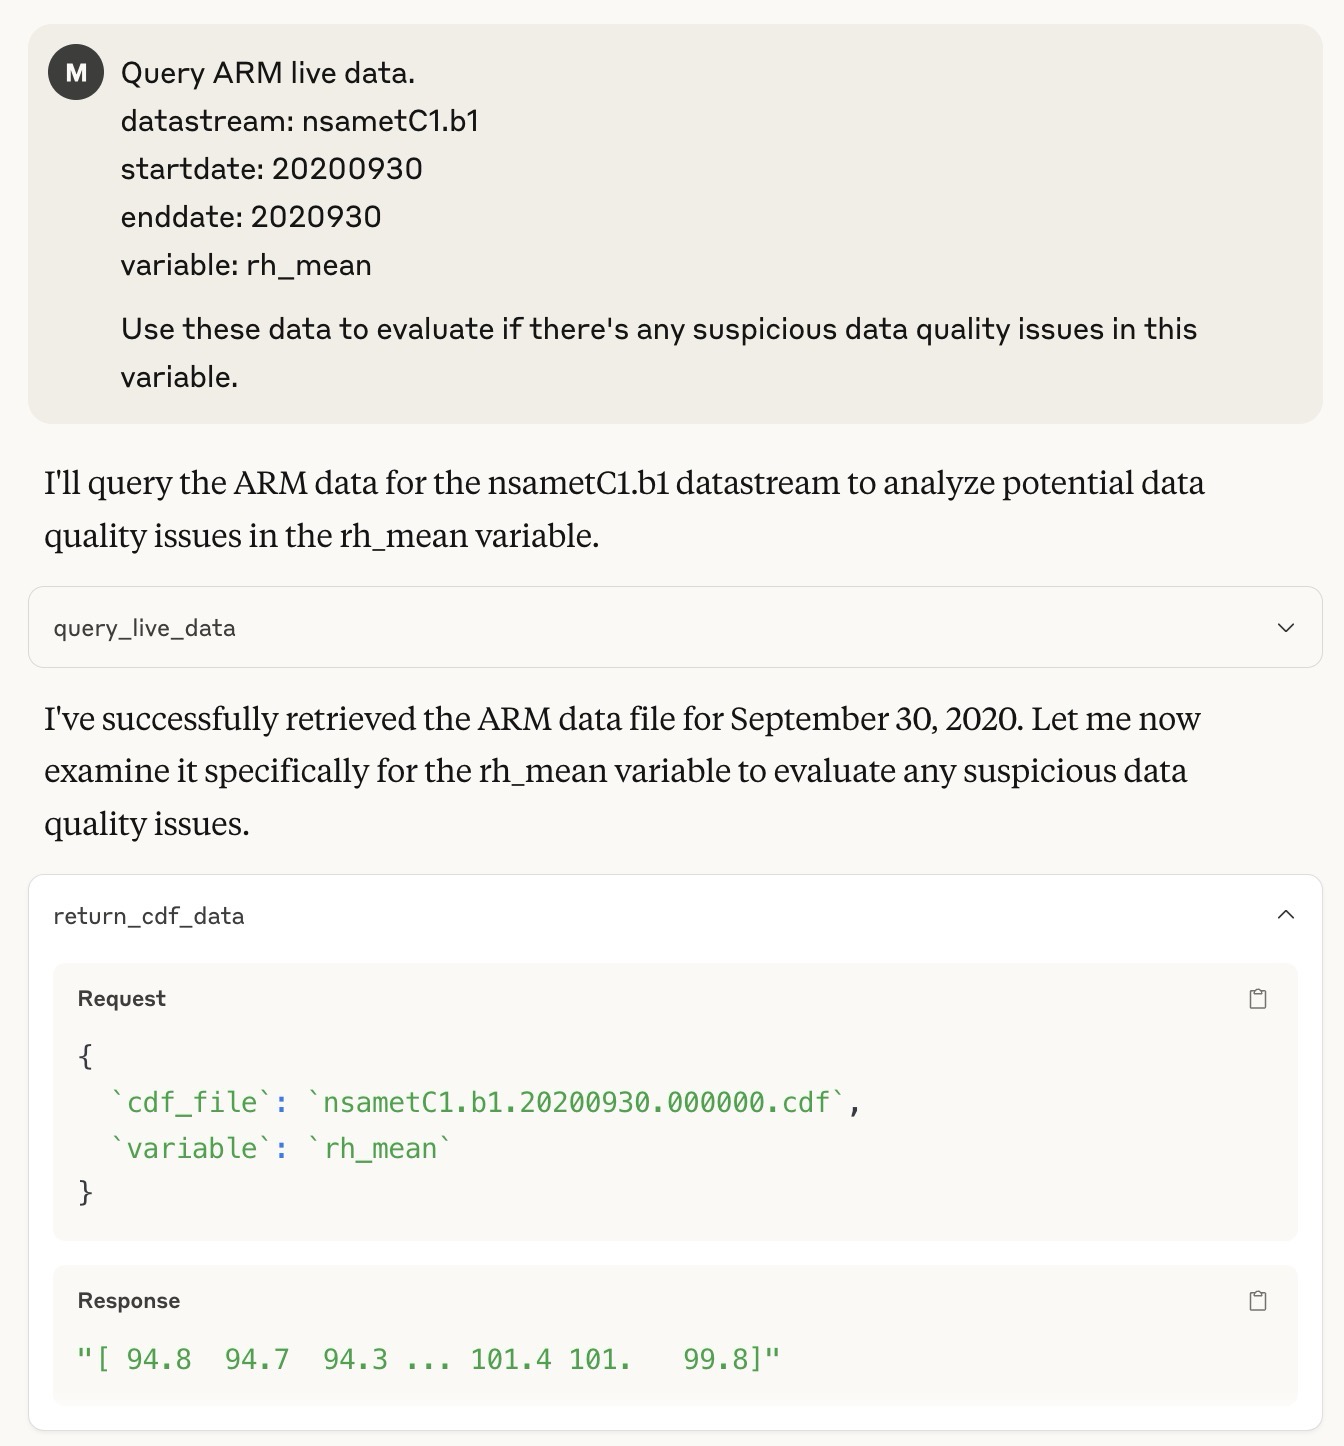
Response from Claude:
Evaluation of Data Quality Issues in the rh_mean Variable (Sept 30, 2020)
Based on my analysis of the relative humidity mean (rh_mean) data from the nsametC1.b1 datastream for September 30, 2020, I’ve identified several suspicious data quality issues that warrant attention.
Key Findings
-
Physically Impossible Values
- The data contains values exceeding 100% relative humidity (up to 101.4%)
- Approximately 33.3% of the sampled values exceed 100% RH
- From a physical perspective, relative humidity cannot exceed 100% under normal atmospheric conditions
-
Quality Control Failures
- Despite these physically impossible values, all quality control flags (qc_rh_mean) are set to 0
- This indicates the automated quality control system failed to identify these obvious anomalies
-
Potential Sensor Issues
- The higher values (>100%) appear toward the end of the day
- This pattern suggests possible sensor drift or calibration issues
- The range of values (7.1%) is relatively wide, indicating variability that could be suspicious
-
Environmental Context Considerations
- The data comes from the North Slope of Alaska (Barrow) in late September
- Arctic environments present challenges for humidity sensors:
- Frost formation on sensors
- Condensation in high humidity conditions
- Rapid temperature fluctuations
Technical Assessment
The statistical analysis reveals:
- Minimum: 94.3%
- Maximum: 101.4%
- Mean: 97.67%
- Standard Deviation: 3.11%
The presence of values exceeding 100% RH is a clear indicator of sensor issues, as this is physically impossible under standard atmospheric conditions. While some specialized meteorological literature discusses “supersaturation” in specific contexts, instrument readings over 100% in standard meteorological stations typically indicate calibration problems, condensation on the sensor, or other technical issues.
Recommendations
-
Data Usage Caution
- Users of this data should treat RH values with skepticism, especially those exceeding 100%
- Consider applying a correction factor or flagging values >100% as questionable
-
Quality Control Review
- The automated QC system should be reviewed to ensure it properly flags physically impossible values
- Consider implementing additional QC checks specifically for the 100% RH threshold
-
Instrument Maintenance
- Check sensor calibration and potentially recalibrate
- Ensure proper heating of the sensor to prevent condensation in high-humidity conditions
-
Metadata Enhancement
- Update dataset documentation to note these issues for data users
- Consider adding specific quality flags for supersaturation conditions
This evaluation highlights the importance of both automated and manual quality control processes in meteorological data, particularly for challenging measurement parameters like relative humidity in extreme environments.
Dev Tools Supporting MCP
The following are the main code editors that support the Model Context Protocol. Click the link to visit the official website for more information.


