Jmeter Mcp Server
What is Jmeter Mcp Server
JMeter MCP Server is a Model Context Protocol (MCP) server designed to execute JMeter tests through MCP-compatible clients, enabling efficient performance testing.
Use cases
Use cases include running load tests on web applications, validating API performance, and integrating JMeter tests into CI/CD pipelines.
How to use
To use JMeter MCP Server, install the required dependencies, ensure JMeter is accessible, configure the .env file, and connect using an MCP-compatible client to send commands for executing JMeter tests.
Key features
Key features include executing JMeter tests in non-GUI mode for better performance, launching JMeter in GUI mode, and capturing execution output for analysis.
Where to use
JMeter MCP Server can be used in performance testing environments, continuous integration systems, and automated testing frameworks where JMeter is utilized.
Clients Supporting MCP
The following are the main client software that supports the Model Context Protocol. Click the link to visit the official website for more information.


Overview
What is Jmeter Mcp Server
JMeter MCP Server is a Model Context Protocol (MCP) server designed to execute JMeter tests through MCP-compatible clients, enabling efficient performance testing.
Use cases
Use cases include running load tests on web applications, validating API performance, and integrating JMeter tests into CI/CD pipelines.
How to use
To use JMeter MCP Server, install the required dependencies, ensure JMeter is accessible, configure the .env file, and connect using an MCP-compatible client to send commands for executing JMeter tests.
Key features
Key features include executing JMeter tests in non-GUI mode for better performance, launching JMeter in GUI mode, and capturing execution output for analysis.
Where to use
JMeter MCP Server can be used in performance testing environments, continuous integration systems, and automated testing frameworks where JMeter is utilized.
Clients Supporting MCP
The following are the main client software that supports the Model Context Protocol. Click the link to visit the official website for more information.
Content
🚀 JMeter MCP Server
This is a Model Context Protocol (MCP) server that allows executing JMeter tests through MCP-compatible clients and analyzing test results.
[!IMPORTANT]
📢 Looking for an AI Assistant inside JMeter? 🚀
Check out Feather Wand
📋 Features
JMeter Execution
- 📊 Execute JMeter tests in non-GUI mode
- 🖥️ Launch JMeter in GUI mode
- 📝 Capture and return execution output
- 📊 Generate JMeter report dashboard
Test Results Analysis
- 📈 Parse and analyze JMeter test results (JTL files)
- 📊 Calculate comprehensive performance metrics
- 🔍 Identify performance bottlenecks automatically
- 💡 Generate actionable insights and recommendations
- 📊 Create visualizations of test results
- 📑 Generate HTML reports with analysis results
🛠️ Installation
Local Installation
-
Install
uv: -
Ensure JMeter is installed on your system and accessible via the command line.
⚠️ Important: Make sure JMeter is executable. You can do this by running:
chmod +x /path/to/jmeter/bin/jmeter
- Install required Python dependencies:
pip install numpy matplotlib
- Configure the
.envfile, refer to the.env.examplefile for details.
# JMeter Configuration
JMETER_HOME=/path/to/apache-jmeter-5.6.3
JMETER_BIN=${JMETER_HOME}/bin/jmeter

# Optional: JMeter Java options
JMETER_JAVA_OPTS="-Xms1g -Xmx2g"
💻 MCP Usage
-
Connect to the server using an MCP-compatible client (e.g., Claude Desktop, Cursor, Windsurf)
-
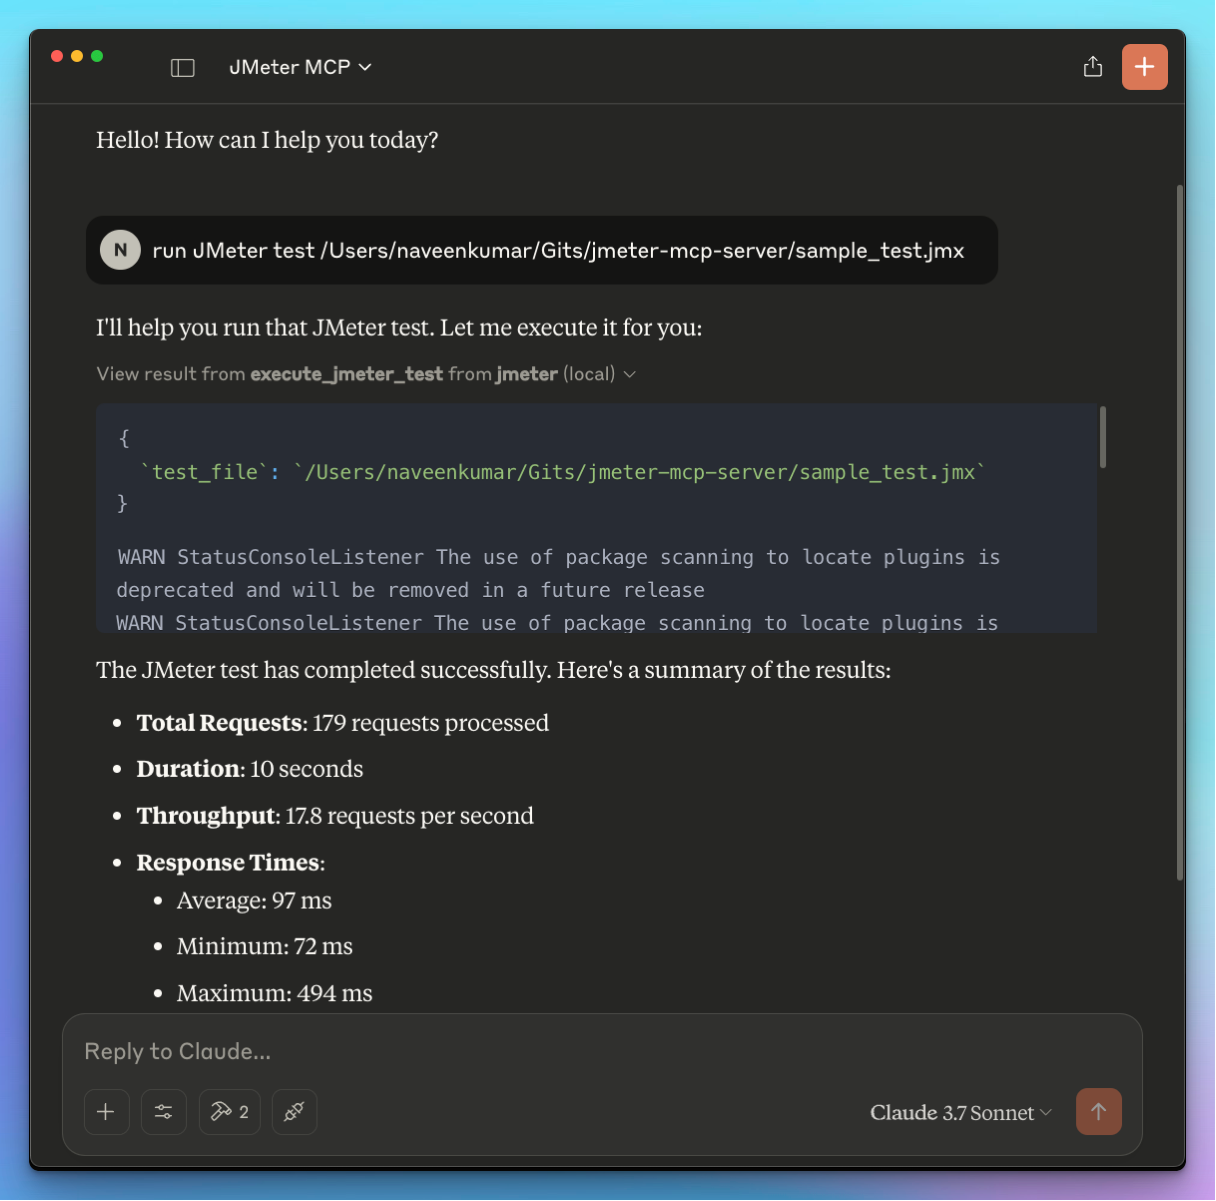
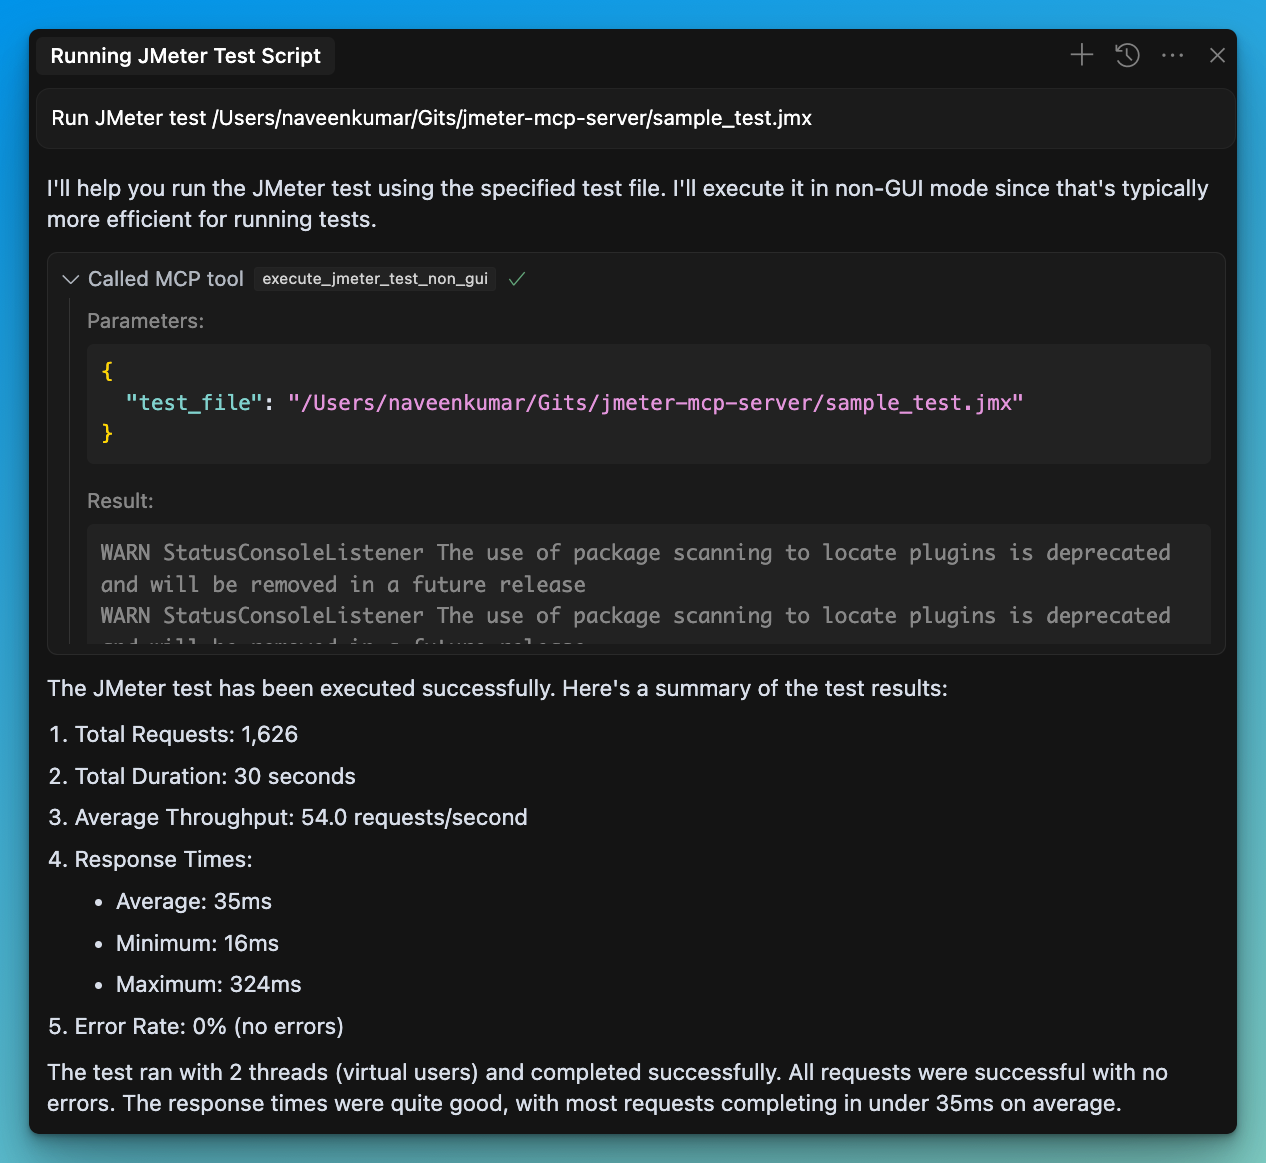
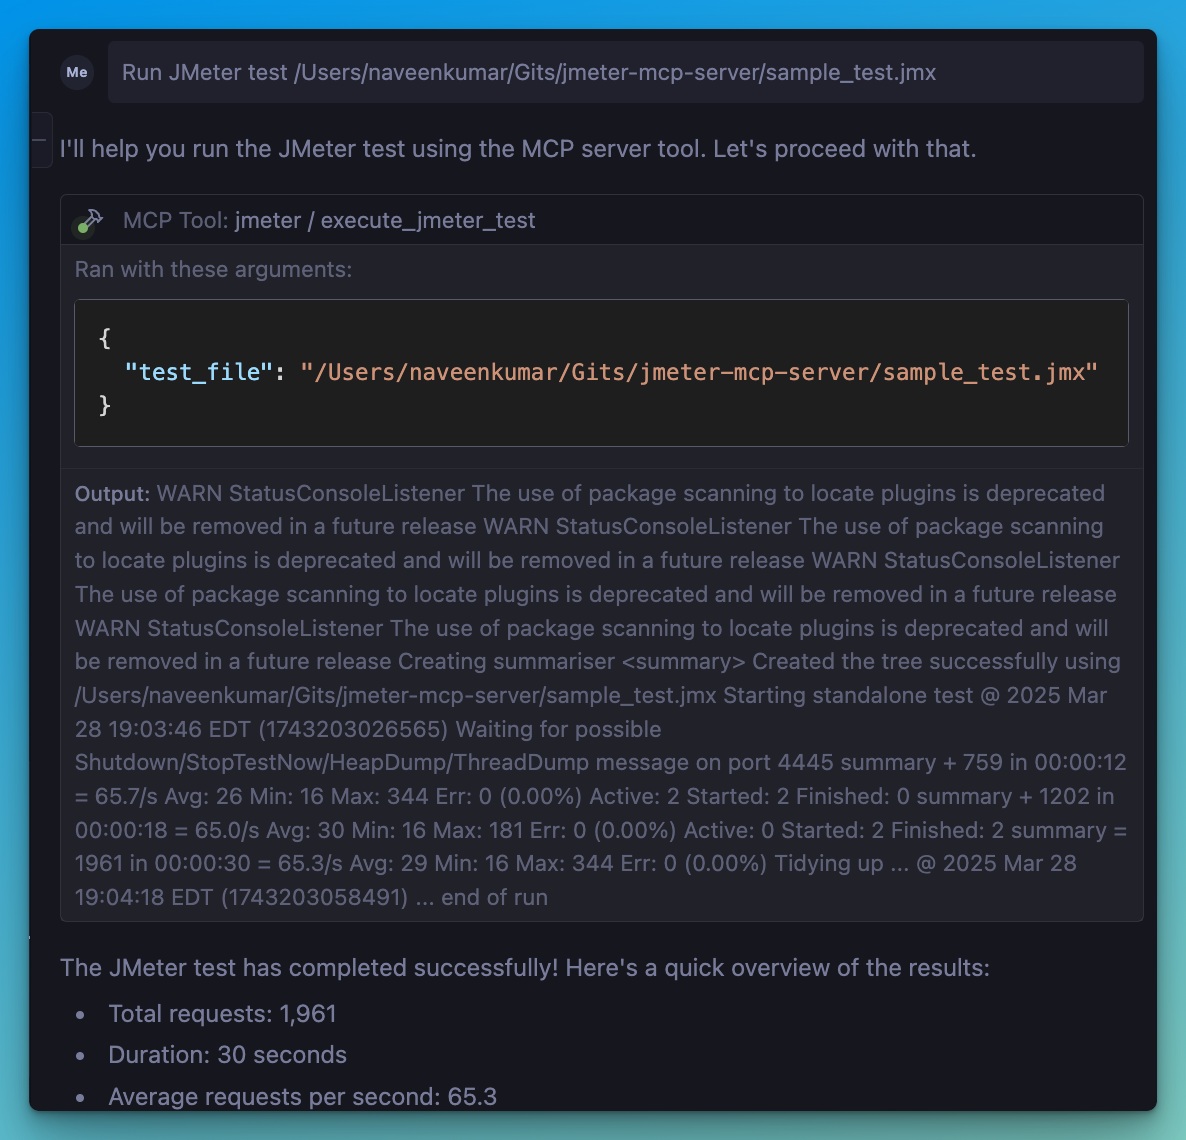
Send a prompt to the server:
Run JMeter test /path/to/test.jmx
- MCP compatible client will use the available tools:
JMeter Execution Tools
- 🖥️
execute_jmeter_test: Launches JMeter in GUI mode, but doesn’t execute test as per the JMeter design - 🚀
execute_jmeter_test_non_gui: Execute a JMeter test in non-GUI mode (default mode for better performance)
Test Results Analysis Tools
- 📊
analyze_jmeter_results: Analyze JMeter test results and provide a summary of key metrics and insights - 🔍
identify_performance_bottlenecks: Identify performance bottlenecks in JMeter test results - 💡
get_performance_insights: Get insights and recommendations for improving performance - 📈
generate_visualization: Generate visualizations of JMeter test results
🏗️ MCP Configuration
Add the following configuration to your MCP client config:
{
  "mcpServers": {
    "jmeter": {
      "command": "/path/to/uv",
      "args": [
        "--directory",
        "/path/to/jmeter-mcp-server",
        "run",
        "jmeter_server.py"
      ]
    }
  }
}
✨ Use Cases
Test Execution
- Run JMeter tests in non-GUI mode for better performance
- Launch JMeter in GUI mode for test development
- Generate JMeter report dashboards
Test Results Analysis
- Analyze JTL files to understand performance characteristics
- Identify performance bottlenecks and their severity
- Get actionable recommendations for performance improvements
- Generate visualizations for better understanding of results
- Create comprehensive HTML reports for sharing with stakeholders
🛑 Error Handling
The server will:
- Validate that the test file exists
- Check that the file has a .jmx extension
- Validate that JTL files exist and have valid formats
- Capture and return any execution or analysis errors
📊 Test Results Analyzer
The Test Results Analyzer is a powerful feature that helps you understand your JMeter test results better. It consists of several components:
Parser Module
- Supports both XML and CSV JTL formats
- Efficiently processes large files with streaming parsers
- Validates file formats and handles errors gracefully
Metrics Calculator
- Calculates overall performance metrics (average, median, percentiles)
- Provides endpoint-specific metrics for detailed analysis
- Generates time series metrics to track performance over time
- Compares metrics with benchmarks for context
Bottleneck Analyzer
- Identifies slow endpoints based on response times
- Detects error-prone endpoints with high error rates
- Finds response time anomalies and outliers
- Analyzes the impact of concurrency on performance
Insights Generator
- Provides specific recommendations for addressing bottlenecks
- Analyzes error patterns and suggests solutions
- Generates insights on scaling behavior and capacity limits
- Prioritizes recommendations based on potential impact
Visualization Engine
- Creates time series graphs showing performance over time
- Generates distribution graphs for response time analysis
- Produces endpoint comparison charts for identifying issues
- Creates comprehensive HTML reports with all analysis results
📝 Example Usage
# Run a JMeter test and generate a results file
Run JMeter test sample_test.jmx in non-GUI mode and save results to results.jtl

# Analyze the results
Analyze the JMeter test results in results.jtl and provide detailed insights

# Identify bottlenecks
What are the performance bottlenecks in the results.jtl file?

# Get recommendations
What recommendations do you have for improving performance based on results.jtl?

# Generate visualizations
Create a time series graph of response times from results.jtl
Dev Tools Supporting MCP
The following are the main code editors that support the Model Context Protocol. Click the link to visit the official website for more information.


