Mcp Server Prometheus
What is Mcp Server Prometheus
mcp-server-prometheus is an MCP server designed to interact with Prometheus metrics and data. It acts as a bridge between Claude and your Prometheus server using the Model Context Protocol (MCP).
Use cases
Use cases for mcp-server-prometheus include monitoring and analyzing Prometheus metrics in real-time, integrating Prometheus data with applications using the MCP, and providing structured access to metric information for developers.
How to use
To use mcp-server-prometheus, you need to configure it with the base URL of your Prometheus instance and optionally provide basic authentication credentials. After installation, add the server configuration to Claude Desktop’s config file.
Key features
Key features include listing and accessing Prometheus metric schemas, detailed metadata for each metric, current statistical information (count, min, max), and support for basic authentication for secured Prometheus instances.
Where to use
undefined
Clients Supporting MCP
The following are the main client software that supports the Model Context Protocol. Click the link to visit the official website for more information.


Overview
What is Mcp Server Prometheus
mcp-server-prometheus is an MCP server designed to interact with Prometheus metrics and data. It acts as a bridge between Claude and your Prometheus server using the Model Context Protocol (MCP).
Use cases
Use cases for mcp-server-prometheus include monitoring and analyzing Prometheus metrics in real-time, integrating Prometheus data with applications using the MCP, and providing structured access to metric information for developers.
How to use
To use mcp-server-prometheus, you need to configure it with the base URL of your Prometheus instance and optionally provide basic authentication credentials. After installation, add the server configuration to Claude Desktop’s config file.
Key features
Key features include listing and accessing Prometheus metric schemas, detailed metadata for each metric, current statistical information (count, min, max), and support for basic authentication for secured Prometheus instances.
Where to use
undefined
Clients Supporting MCP
The following are the main client software that supports the Model Context Protocol. Click the link to visit the official website for more information.
Content
mcp-server-prometheus
MCP server for interacting with Prometheus metrics and data.
This is a TypeScript-based MCP server that implements a Prometheus API interface. It provides a bridge between Claude and your Prometheus server through the Model Context Protocol (MCP).
Demo
Features
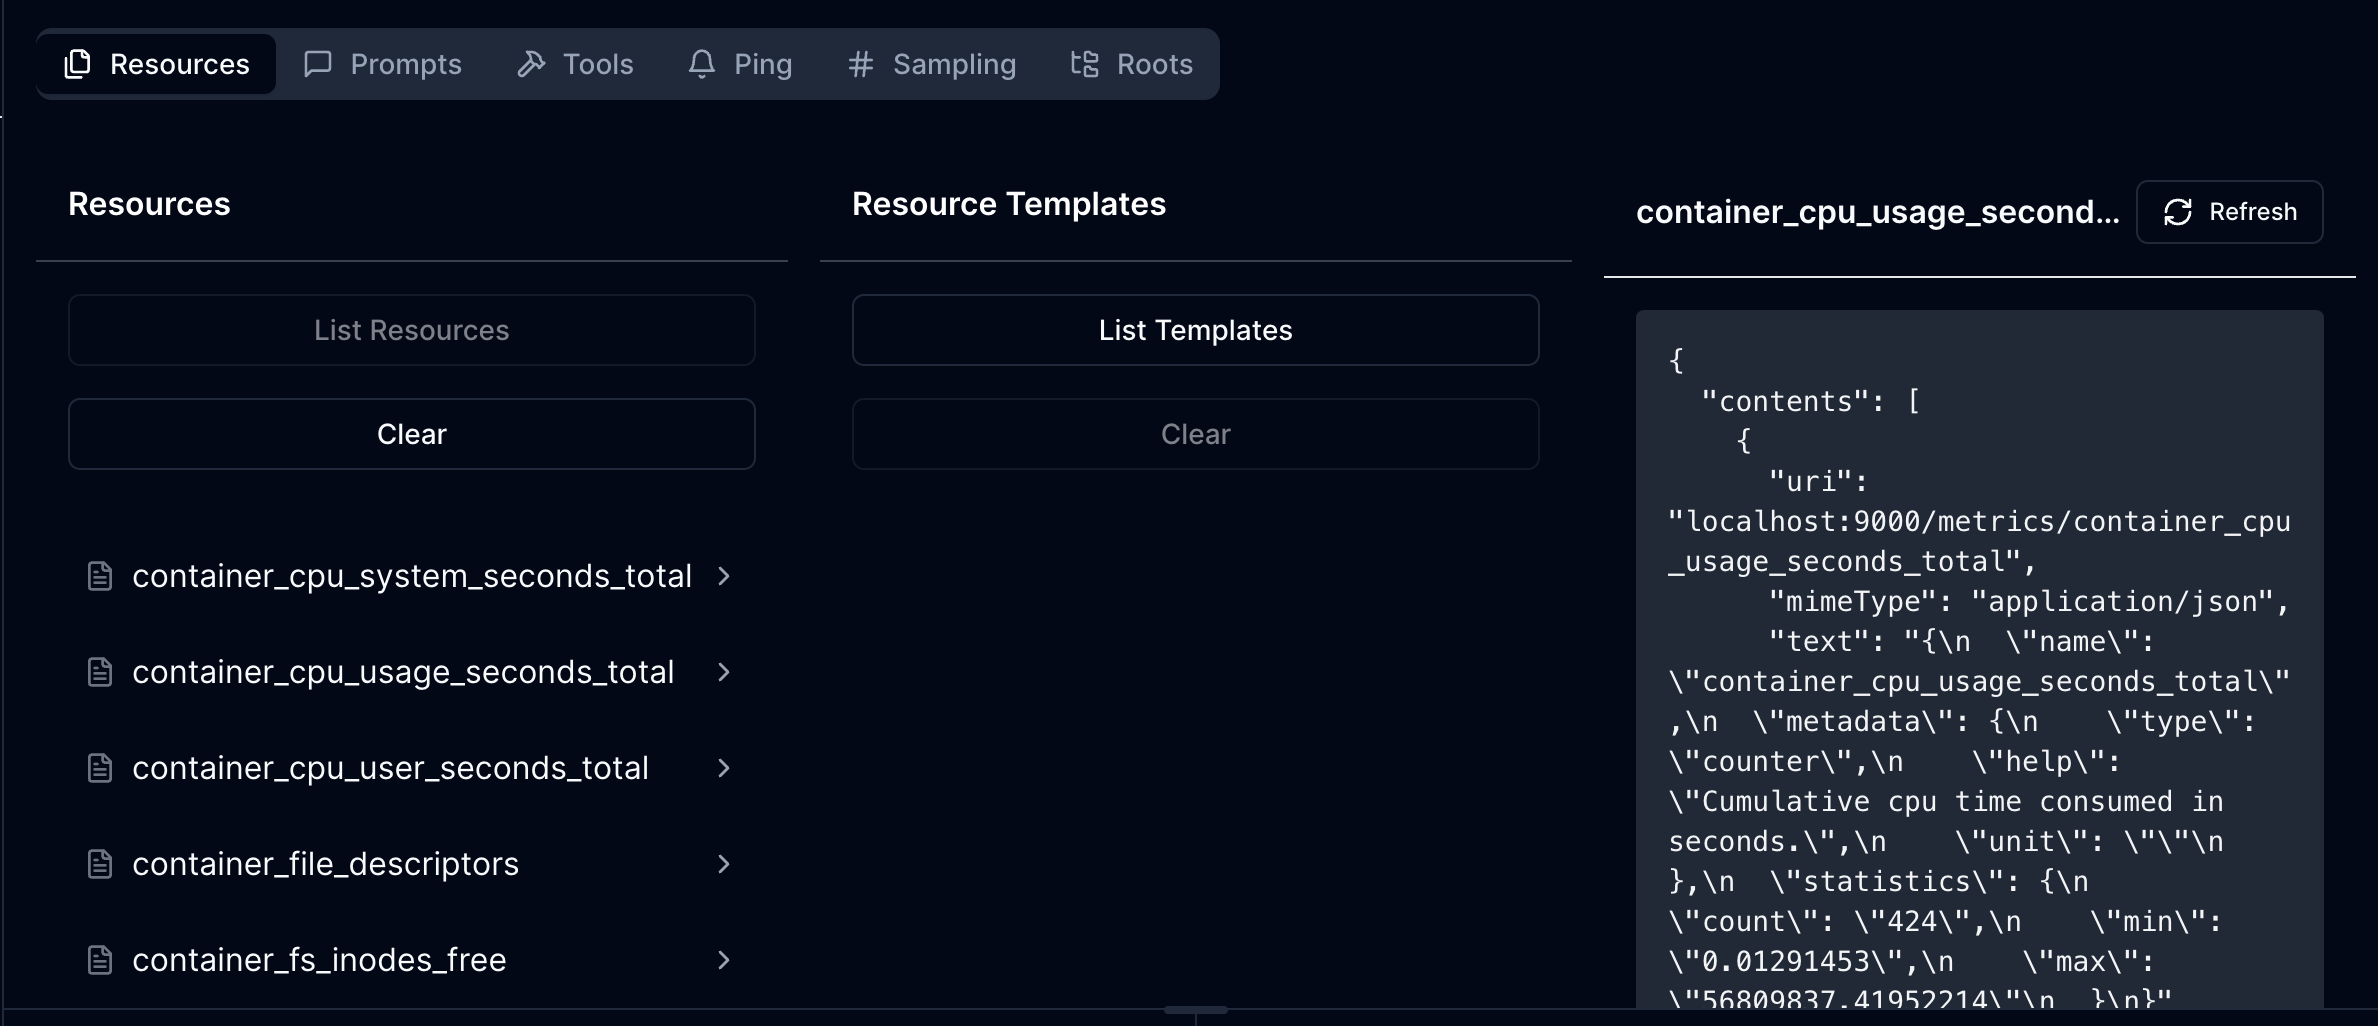
Resources
- List and access Prometheus metric schema
- Each metric resource provides:
- Metric name and description
- Detailed metadata from Prometheus
- Statistical information (count, min, max)
- JSON mime type for structured data access
Current Capabilities
- List all available Prometheus metrics with descriptions
- Read detailed metric information including:
- Metadata and help text
- Current statistical data (count, min, max values)
- Basic authentication support for secured Prometheus instances
Configuration
The server requires the following environment variable:
PROMETHEUS_URL: The base URL of your Prometheus instance
Optional authentication configuration:
PROMETHEUS_USERNAME: Username for basic auth (if required)PROMETHEUS_PASSWORD: Password for basic auth (if required)
Development
Install dependencies:
npm install
Build the server:
npm run build
For development with auto-rebuild:
npm run watch
Installation
To use with Claude Desktop, add the server config:
On MacOS: ~/Library/Application Support/Claude/claude_desktop_config.json
On Windows: %APPDATA%/Claude/claude_desktop_config.json
{
  "mcpServers": {
    "mcp-server-prometheus": {
      "command": "/path/to/mcp-server-prometheus/build/index.js",
      "env": {
        "PROMETHEUS_URL": "http://your-prometheus-instance:9090"
      }
    }
  }
}
Debugging
Since MCP servers communicate over stdio, debugging can be challenging. We recommend using the MCP Inspector:
npm run inspector
The Inspector will provide a URL to access debugging tools in your browser.
API Structure
The server exposes Prometheus metrics through the following URI structure:
- Base URI:
http://your-prometheus-instance:9090 - Metric URIs:
http://your-prometheus-instance:9090/metrics/{metric_name}
Each metric resource returns JSON data containing:
- Metric name
- Metadata (help text, type)
- Current statistics (count, min, max)
Dev Tools Supporting MCP
The following are the main code editors that support the Model Context Protocol. Click the link to visit the official website for more information.


